Blog
84% Of The Planet Has Never Used AI. Your Strategy Is Built For The Other 16%.
Roughly 6.8 billion people have never typed a prompt. About 1.3 billion have used a free chatbot. The number paying for AI or coding with it is a rounding error. I read a chart this week that reframed the whole market, and most boards have the proportions exactly backwards.
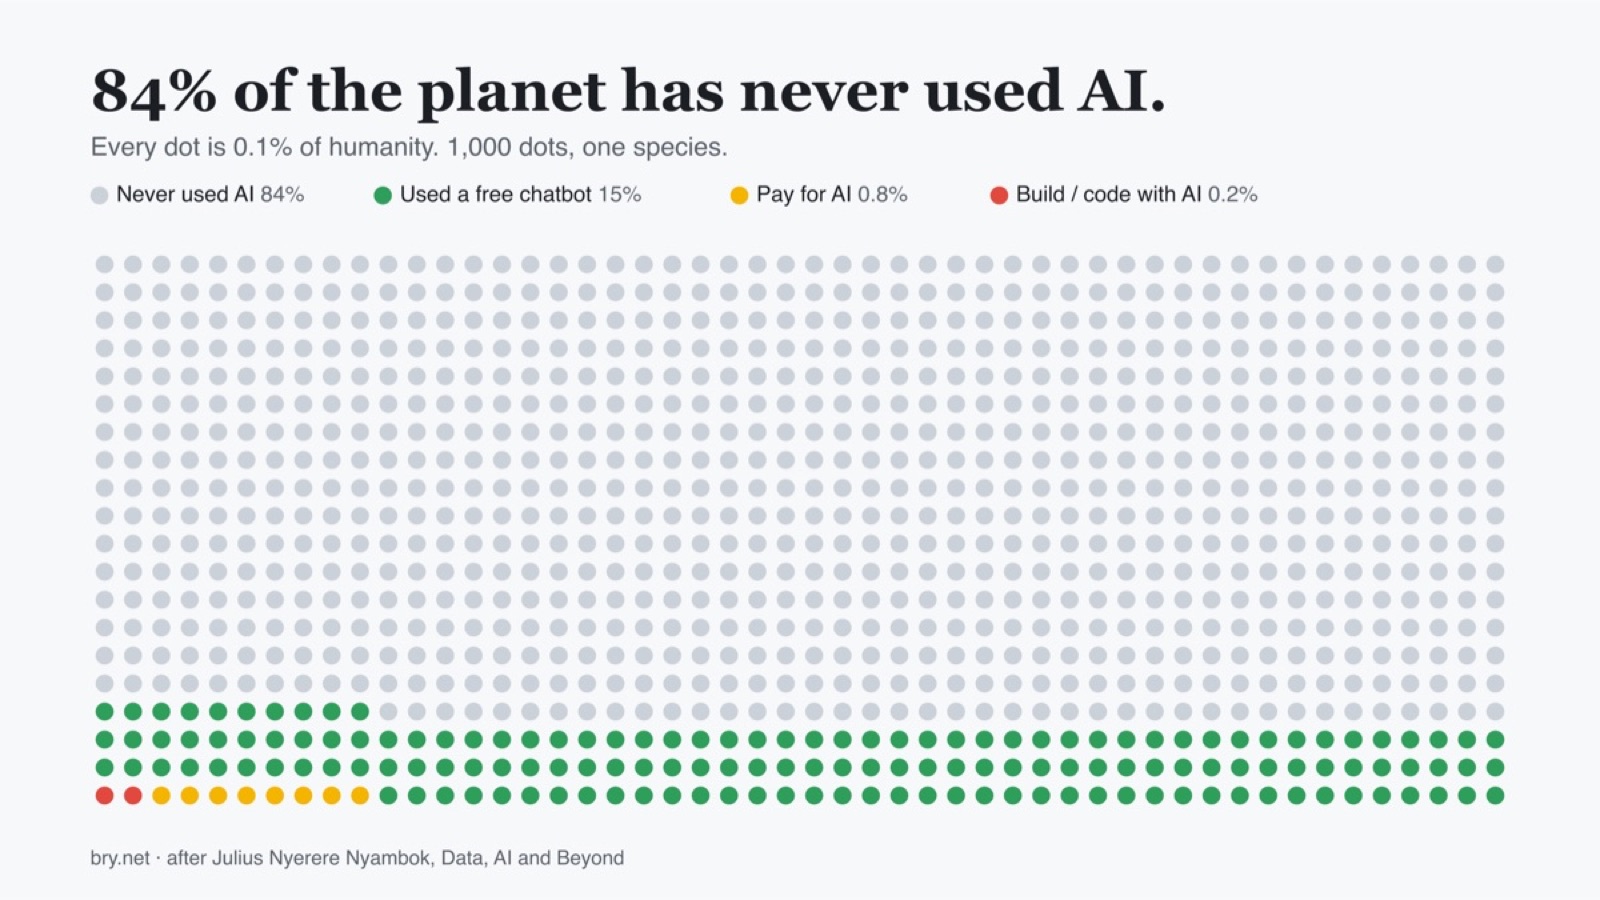
I saw a chart this week that I have not been able to put down. It comes from a piece by Julius Nyerere Nyambok in the Data, AI and Beyond publication, and the whole thing is one image with the labels stripped off.
It is a grid of dots, one for every slice of the human population. Almost all of them are gray. The gray dots are the people who have never used AI. Not once. A thin band of green sits underneath, and a few yellow and red dots are scattered in so faintly you have to look twice to find them.
Here are the numbers behind the colors.
- Gray, about 84%. Roughly 6.8 billion people who have never interacted with AI in any form.
- Green, about 16%. Roughly 1.3 billion people who have used a free chatbot like ChatGPT or Gemini at least once.
- Yellow and red, a rounding error. The people paying for AI or using it to write code. On a chart of the whole species, you can barely see them.
Sit with the gray for a second. We have spent two years talking about AI like it already won. The chart says it has barely started.
The room I am usually in lives in the red dots
I run fractional CTO and CAIO engagements. The CEOs I talk to, the engineering leads, the board members, almost all of them live in that invisible sliver at the bottom of the chart. They pay for three or four AI tools. Their teams write code with Claude. They argue about model selection in Slack.
That is a strange place to build a worldview from. When everyone in your meetings is a red dot, you start to assume the market is mostly red dots. It is not. It is 84% gray.
I catch myself doing it too. I will tell a client "everybody is using this now," and then I remember my mother has never opened a chatbot, my bandmates have not, the guy who fixed my furnace last month has not. Everybody in my feed is not everybody.
Why the gray is the actual story
You can read that 84% two ways, and which way you pick tells me a lot about your company.
The first read is that AI is a niche technology that got a loud two years and a lot of venture money, and the gray means the hype outran the reality. That is the bearish case, and it is not crazy. Most people on earth have looked at this and decided it does not change their Tuesday.
The second read is the one I hold. The gray is not proof the technology failed. It is the size of the room nobody has built for yet. Sixteen percent adoption is not a ceiling. It is the part of the S-curve where the early people have shown up and the product is still too hard, too expensive, or too irrelevant for the next billion.
Both reads cannot be planned for the same way. So pick one on purpose, out loud, in a meeting, instead of drifting into the assumption that the whole world is already in the green band.
What the green-to-red gap is really telling you
Look at the drop from green to yellow. A billion-plus people have tried a chatbot. Almost none of them pay for one. That gap is the most honest signal in the chart.
It means the free tier is doing its job and the value proposition above it is not landing for normal people yet. The product that converts a gray dot to green is good enough to give away. The product that converts a green dot to a paying yellow dot mostly does not exist for anyone who is not technical or not at work.
If you are building or buying AI, that gap is your map. The money over the next decade is not in selling a fifth tool to the red dots. It is in the boring, unglamorous work of making one useful thing simple enough that a green dot will pay for it, or a gray dot will try it.
What to actually do with this
You do not need a strategy offsite for this. You need to correct three assumptions this week.
- Audit who your roadmap is built for. Pull up your last quarter of feature decisions. Count how many assumed an AI-fluent user. If it is most of them, you are building for the red dots and calling it the market.
- Find your own gray dots. Talk to three people in your actual customer base who have never used AI on purpose. Not a persona. Real people. Ask what would make them try once. Their answer is worth more than another model benchmark.
- Name your read on the 84%. Decide as a leadership team whether you believe the gray is a dead end or an unbuilt market, and write it down. Every AI investment you make for the next year should trace back to that one sentence.
The close
The loudest rooms in tech right now are arguing about the difference between two red dots. Which model. Which agent framework. Which eval harness. I am in those rooms, and the arguments are real, and they are also a sideshow.
The story on the chart is the gray. Eighty-four percent of the people alive have not started. Whether that is a crisis or an opportunity is not a fact about AI. It is a decision about you.
Credit where it is due: the chart and the framing come from Julius Nyerere Nyambok's piece in Data, AI and Beyond. I made my own version of his image because I could not stop thinking about it. That is usually the sign of a good chart.